


 16 / 48

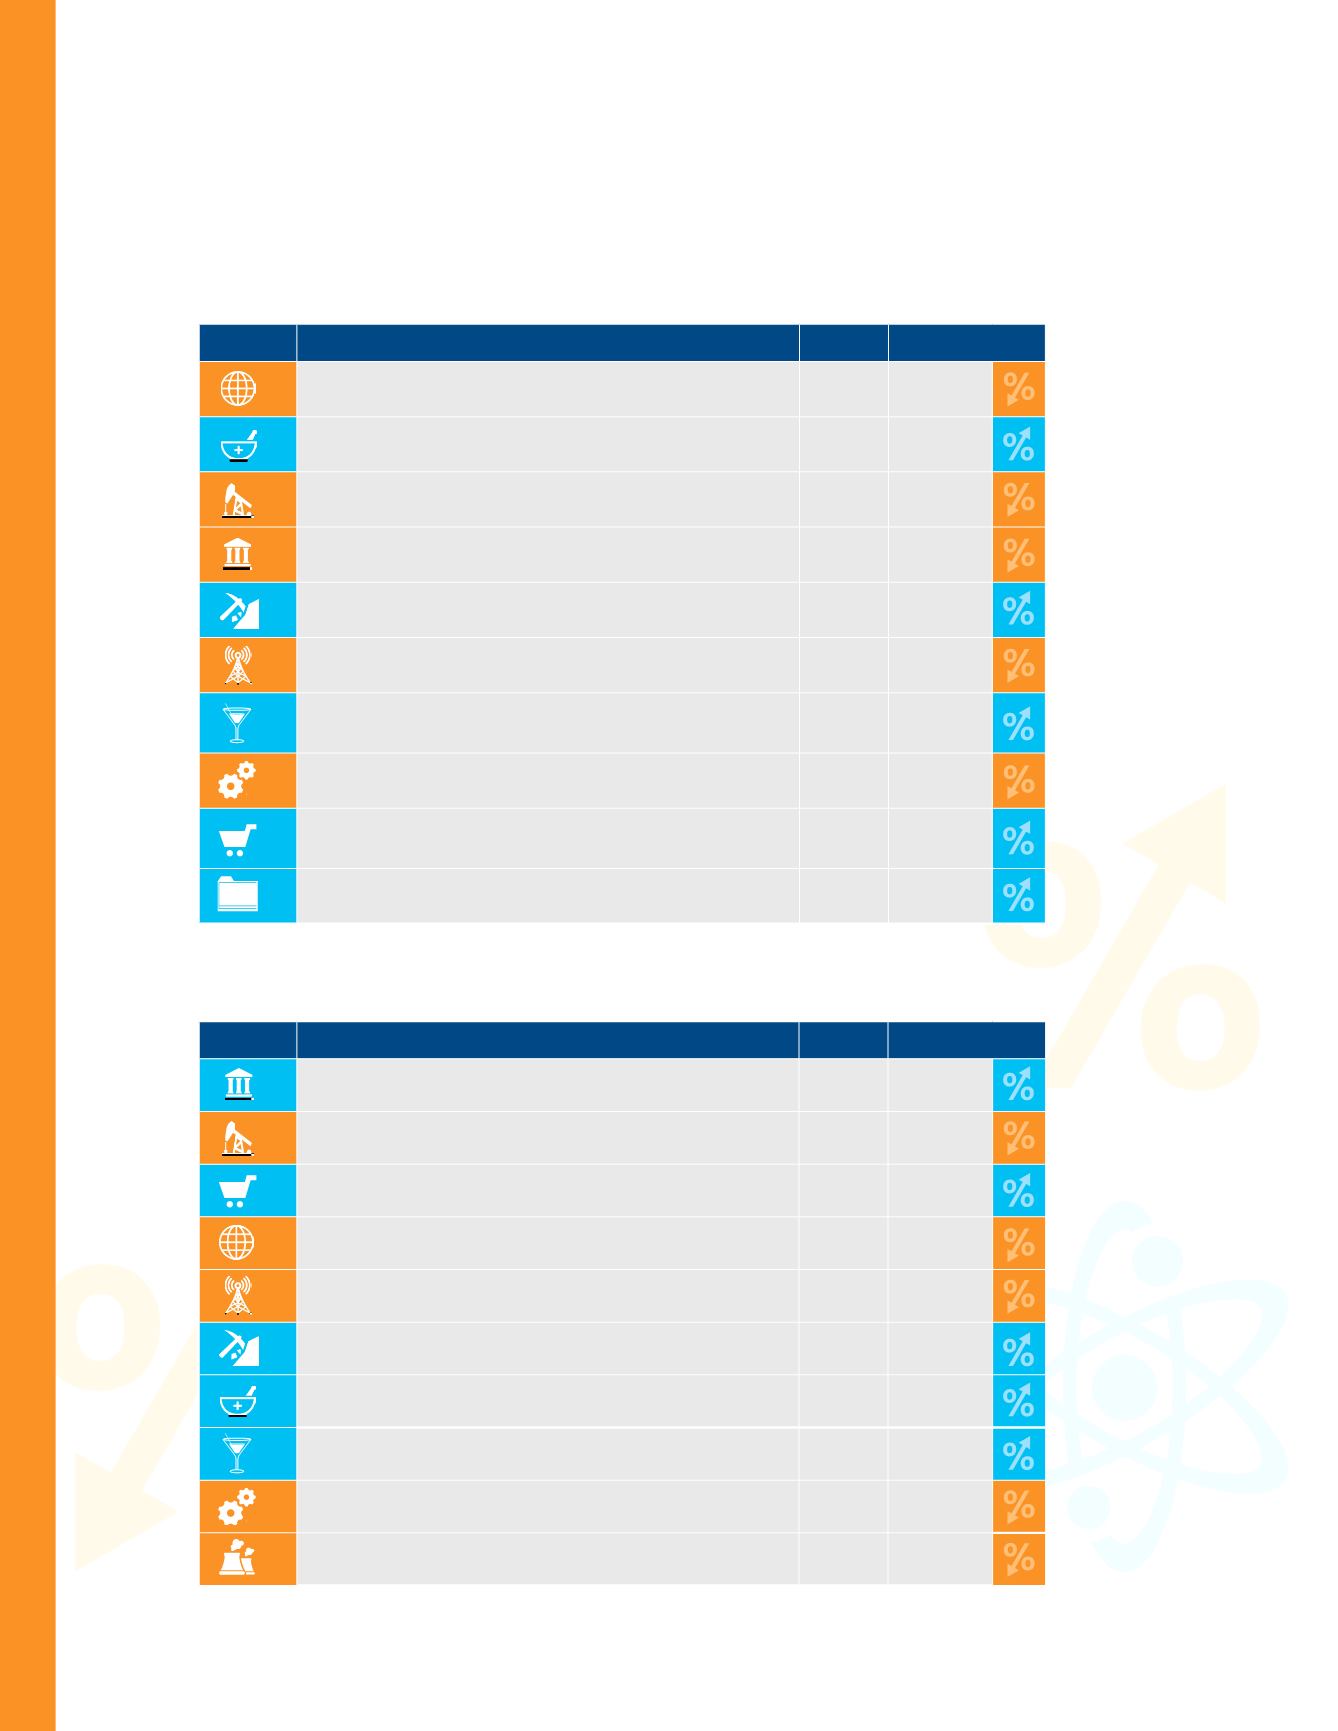
Global DR Liquidity by Industry
DR Trading Value (in USD Billions)
1
INDUSTRY
2016
VALUE
CHANGE
VS. 2015
Internet
$714 -18%
Pharmaceuticals
$388 24%
Oil & Gas
$352 -4%
Banks
$240 -2%
Mining
$158 30%
Telecommunications
$145 -19%
Beverages
$115 12%
Semiconductors
$113 -24%
Iron/Steel
$94 7%
Software
$94 40%
DR Trading Volume (in Billions)
1
INDUSTRY
2016
VOLUME
CHANGE
VS. 2015
Banks
27 8%
Oil & Gas
23 -11%
Iron/Steel
20 21%
Internet
15 -16%
Telecommunications
12 -15%
Mining
9 30%
Pharmaceuticals
8 27%
Beverages
5 9%
Semiconductors
4 -29%
Building Materials
3 -9%
Global DR Trends by Sector
1
Represents the top 10 industries as defined by Bloomberg.
16