


 10 / 48

Most Liquid DR Exchanges
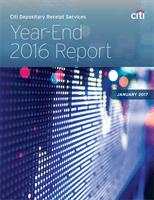
DR Trading Value
1,2
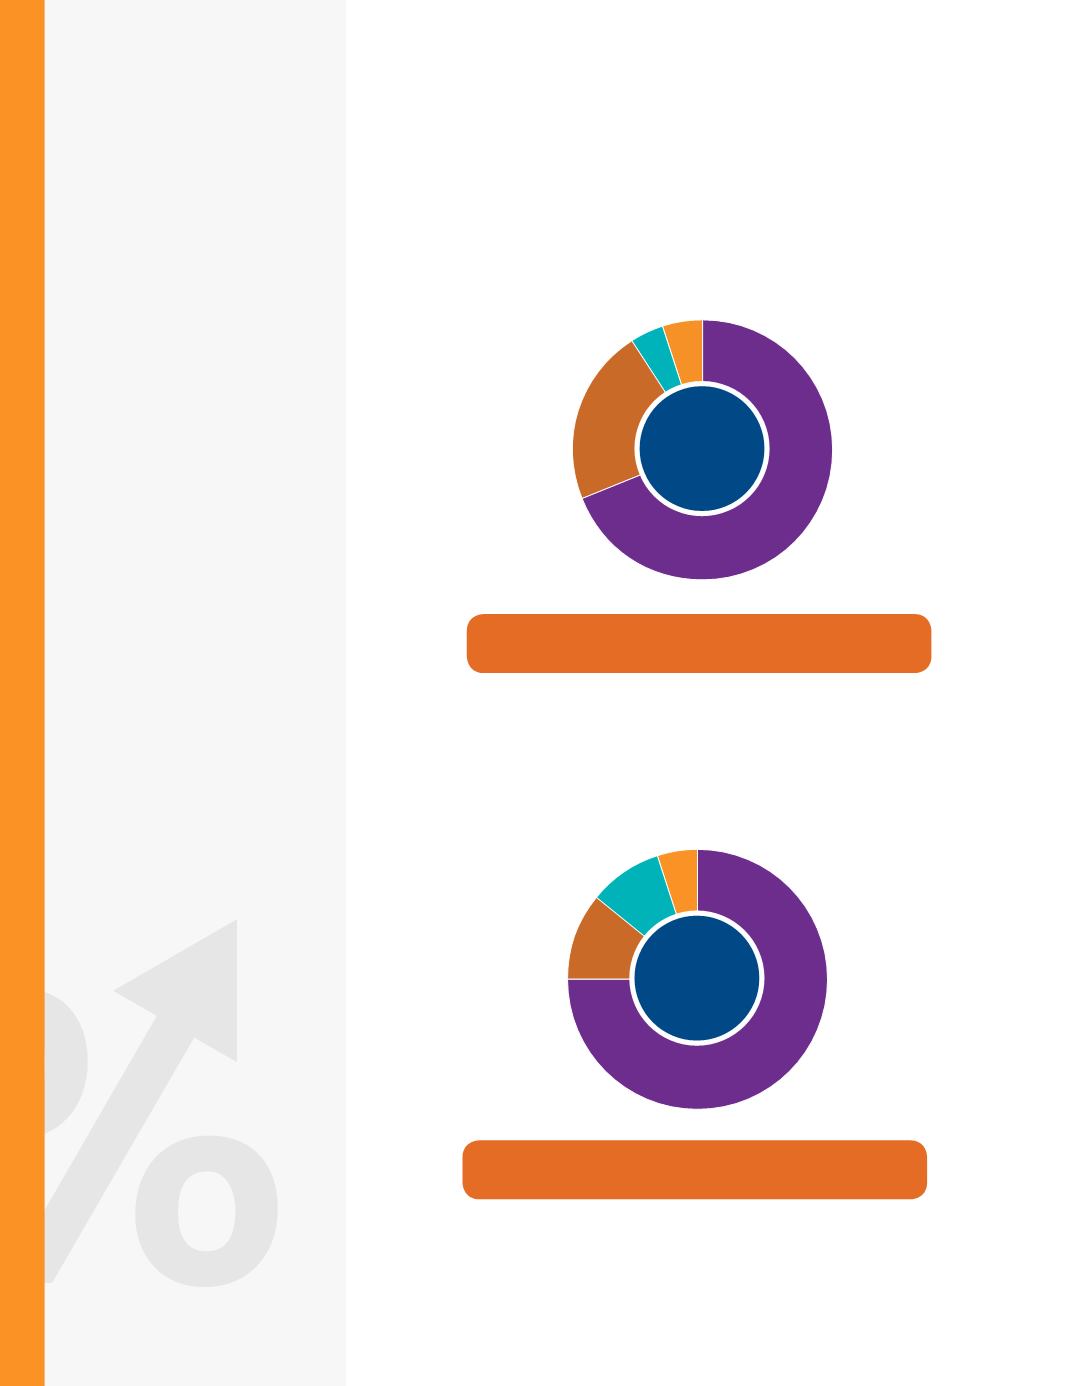
DR Trading Volume
1,2
NYSE
NASDAQ
LSE OTC
5
%
4
%
22
%
69
%
NYSE
NASDAQ
LSE
OTC
5
%
9
%
11
%
75
%
Total DR Value: $2,922.9B
Total DR Volume: 155.1B DRs Traded
DR Liquidity
Highlights
Trading Value
• Down
4%
from
2015 primarily due
to decreases in DR
trading value on NYSE
•
40%
of total
from Asia-Pacific
•
47%
of total
from EMEA
•
13%
of total
from LATAM
Trading Volume
• Down
2%
from
2015 primarily due to
decreases in DR trading
volume on LSE
•
45%
of total
from EMEA
•
31%
of total
from LATAM
•
24%
of total
from Asia-Pacific
Global DR Liquidity (cont.)
10