


 27 / 48

1
Data as of December 31, 2016.
2
DR trading volume has been unadjusted for certain corporate actions
including stock splits, stock dividends and rights offerings.
DR ACCESS PRODUCTS
ABOUT CITI DEPOSITARY
RECEIPT SERVICES
INTERNATIONAL
INVESTING TRENDS
REGIONAL TRENDS
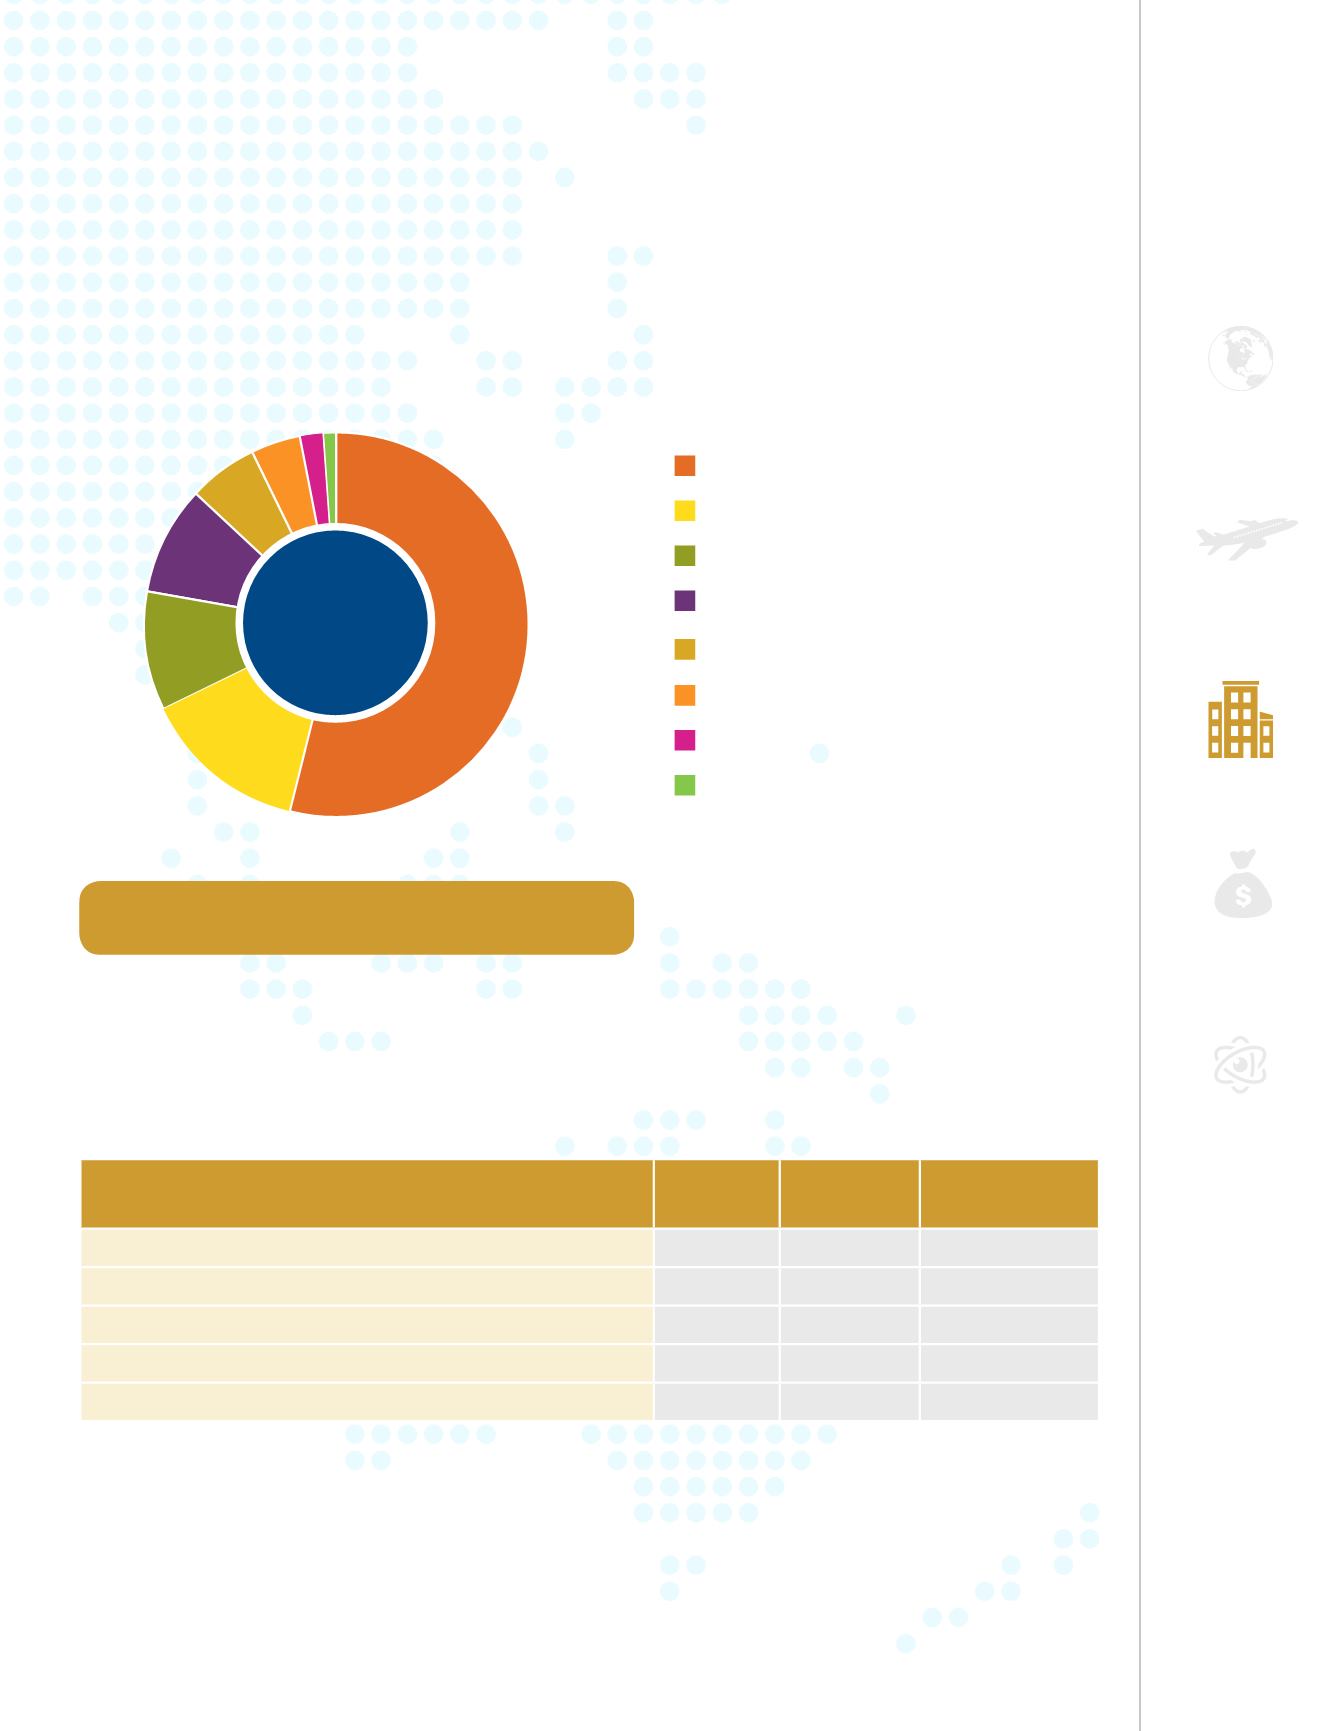
GLOBAL DR TRENDS
Top 5 Most Liquid DR Programs
1,2
Source: Bloomberg.
DR Trading Volume
1,2
44.9
AUSTRALIA
CHINA
INDIA
TAIWAN
SOUTH KOREA
OTHER
HONG KONG
JAPAN
54
%
14
%
10
%
9
%
6
%
4
%
2
%
1
%
Total DR Trading Volume: 36.8B
Issuer
Country Exchange
2016 Volume
(DR Millions)
Alibaba Group Holding Ltd
China NYSE
3,730.9
JD.comInc
China NASDAQ 3,141.8
ICICI Bank Ltd
India
NYSE
2,771.9
Vipshop Holdings Ltd
China NYSE
1,982.9
Taiwan Semiconductor Manufacturing Co Ltd
Taiwan NYSE
1,787.7
27
Citi Depositary Receipt Services Year-End 2016 Report