


 29 / 48

1
Data as of December 31, 2016.
2
DR trading volume has been unadjusted for certain corporate actions
including stock splits, stock dividends and rights offerings.
DR ACCESS PRODUCTS
ABOUT CITI DEPOSITARY
RECEIPT SERVICES
INTERNATIONAL
INVESTING TRENDS
REGIONAL TRENDS
GLOBAL DR TRENDS
Top 5 Most Liquid DR Programs
1,2
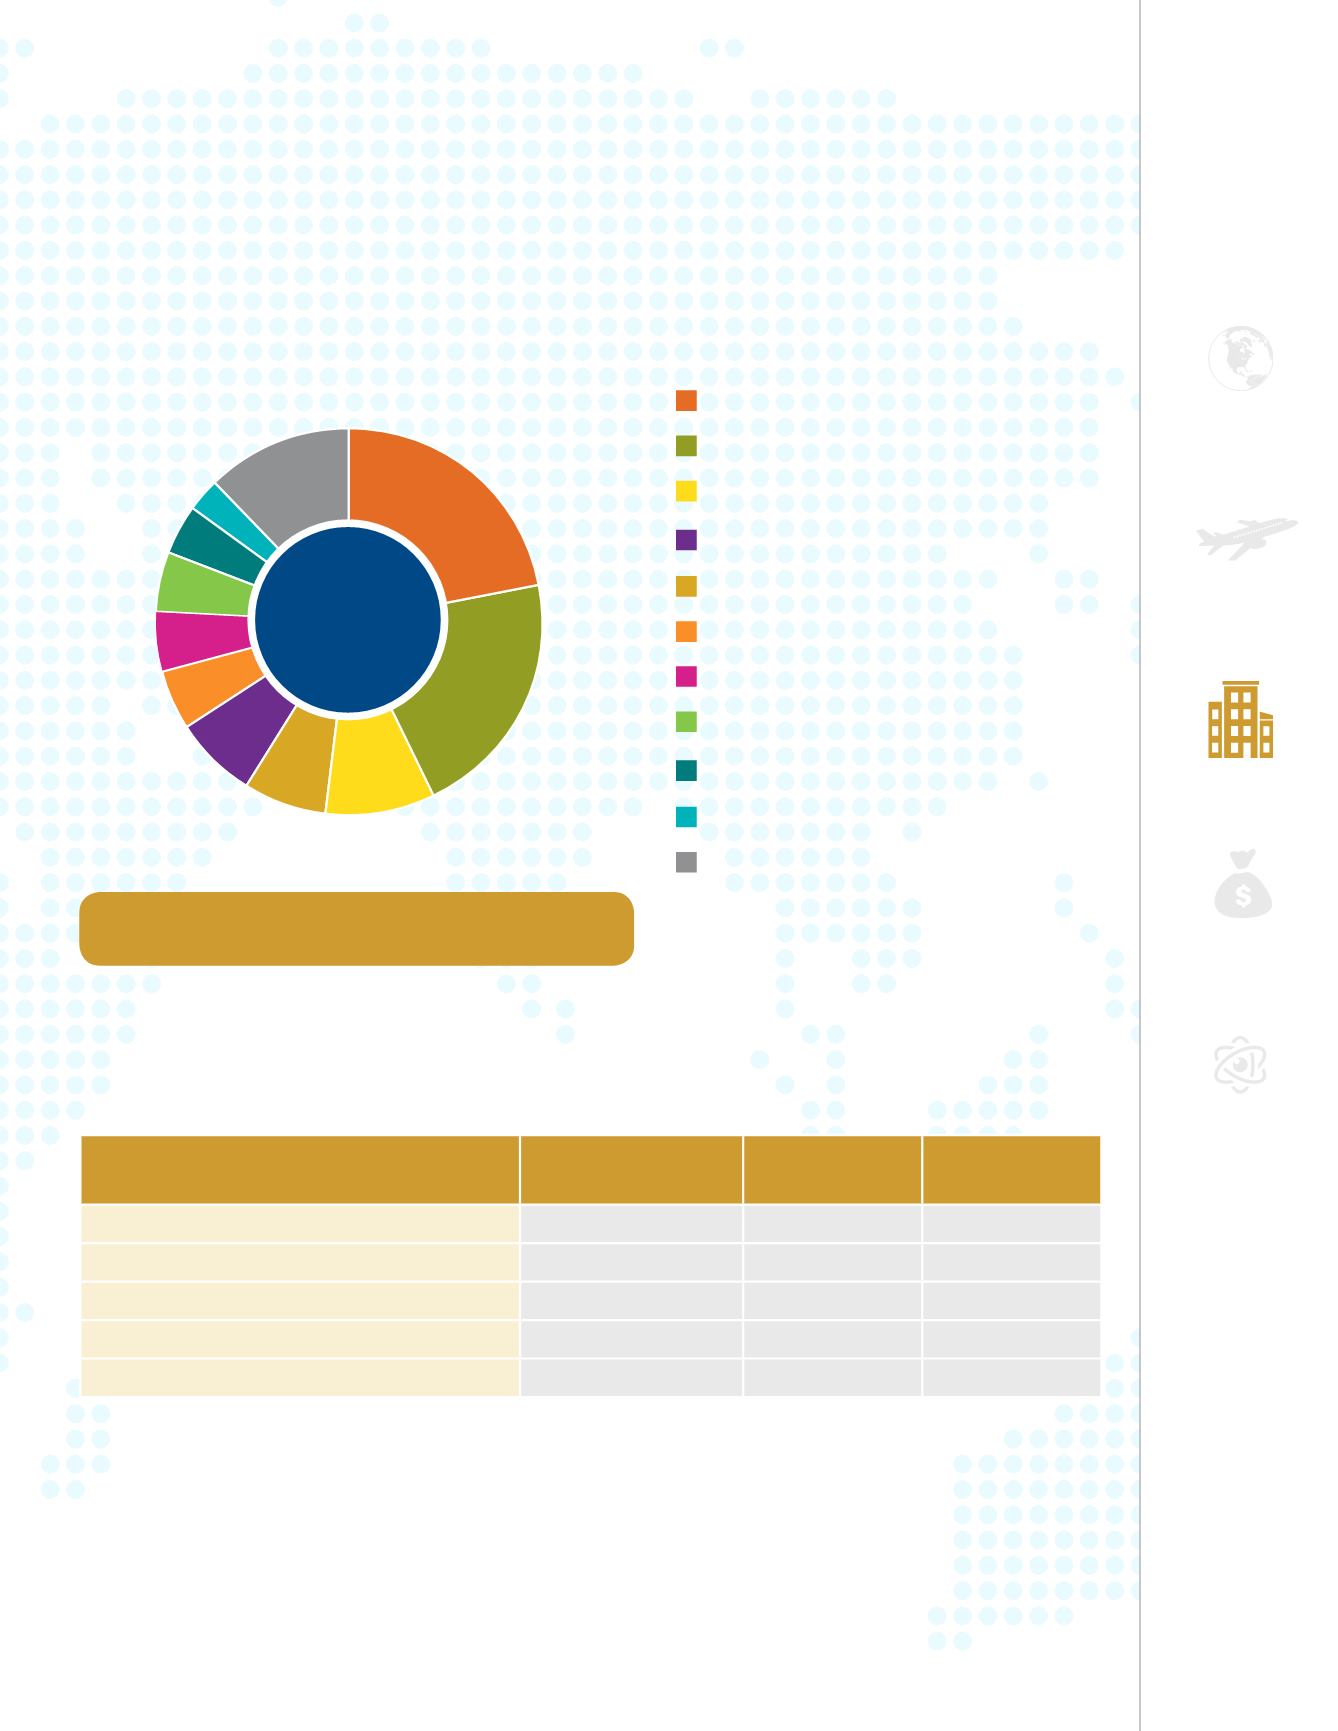
DR Trading Volume
1,2
44.9
22
%
21
%
9
%
7
%
7
%
5
%
5
%
5
%
4
%
3
%
12
%
SOUTH AFRICA
UK
RUSSIA
LUXEMBOURG
SWITZERLAND
NETHERLANDS
FRANCE
FINLAND
SPAIN
OTHER
ISRAEL
Total DR Trading Volume: 69.3B
Source: Bloomberg.
Issuer
Country
Exchange
2016 Volume
(DR Millions)
ArcelorMittal
Luxembourg
NYSE
5,659.7
Gazprom PJSC
Russia
LSE
4,051.5
Nokia OYJ
Finland
NYSE
3,411.7
Sberbank of Russia PJSC
Russia
LSE
2,828.2
Royal Dutch Shell plc
UK
NYSE
2,012.4
29
Citi Depositary Receipt Services Year-End 2016 Report