
3
Citi Depositary Receipt Services
Trends in Regional Trading Volume
1, 2
(in DR billions)
Latam
EMEA
APAC
YTD
June 2016
YTD
June 2015
YTD
June 2014
YTD
June 2013
YTD
June 2012
YTD
June 2011
YTD
June 2010
YTD
June 2009
YTD
June 2008
YTD
June 2007
80.1 79.4
78.7
75.7
82.4
84.5
81.3
80.0
79.2
51.6
25.8
21.2
20.5
21.9
20.4
22.8
24.7
22.3
21.3
15.1
22.6
22.1
16.6
17.0
21.2
19.3
27.2
15.1
33.0
31.7
25.8
19.9
33.7
35.4
38.6
43.4
42.8
39.2
30.6
21.4
Source: Bloomberg and Depositary Data Interchange
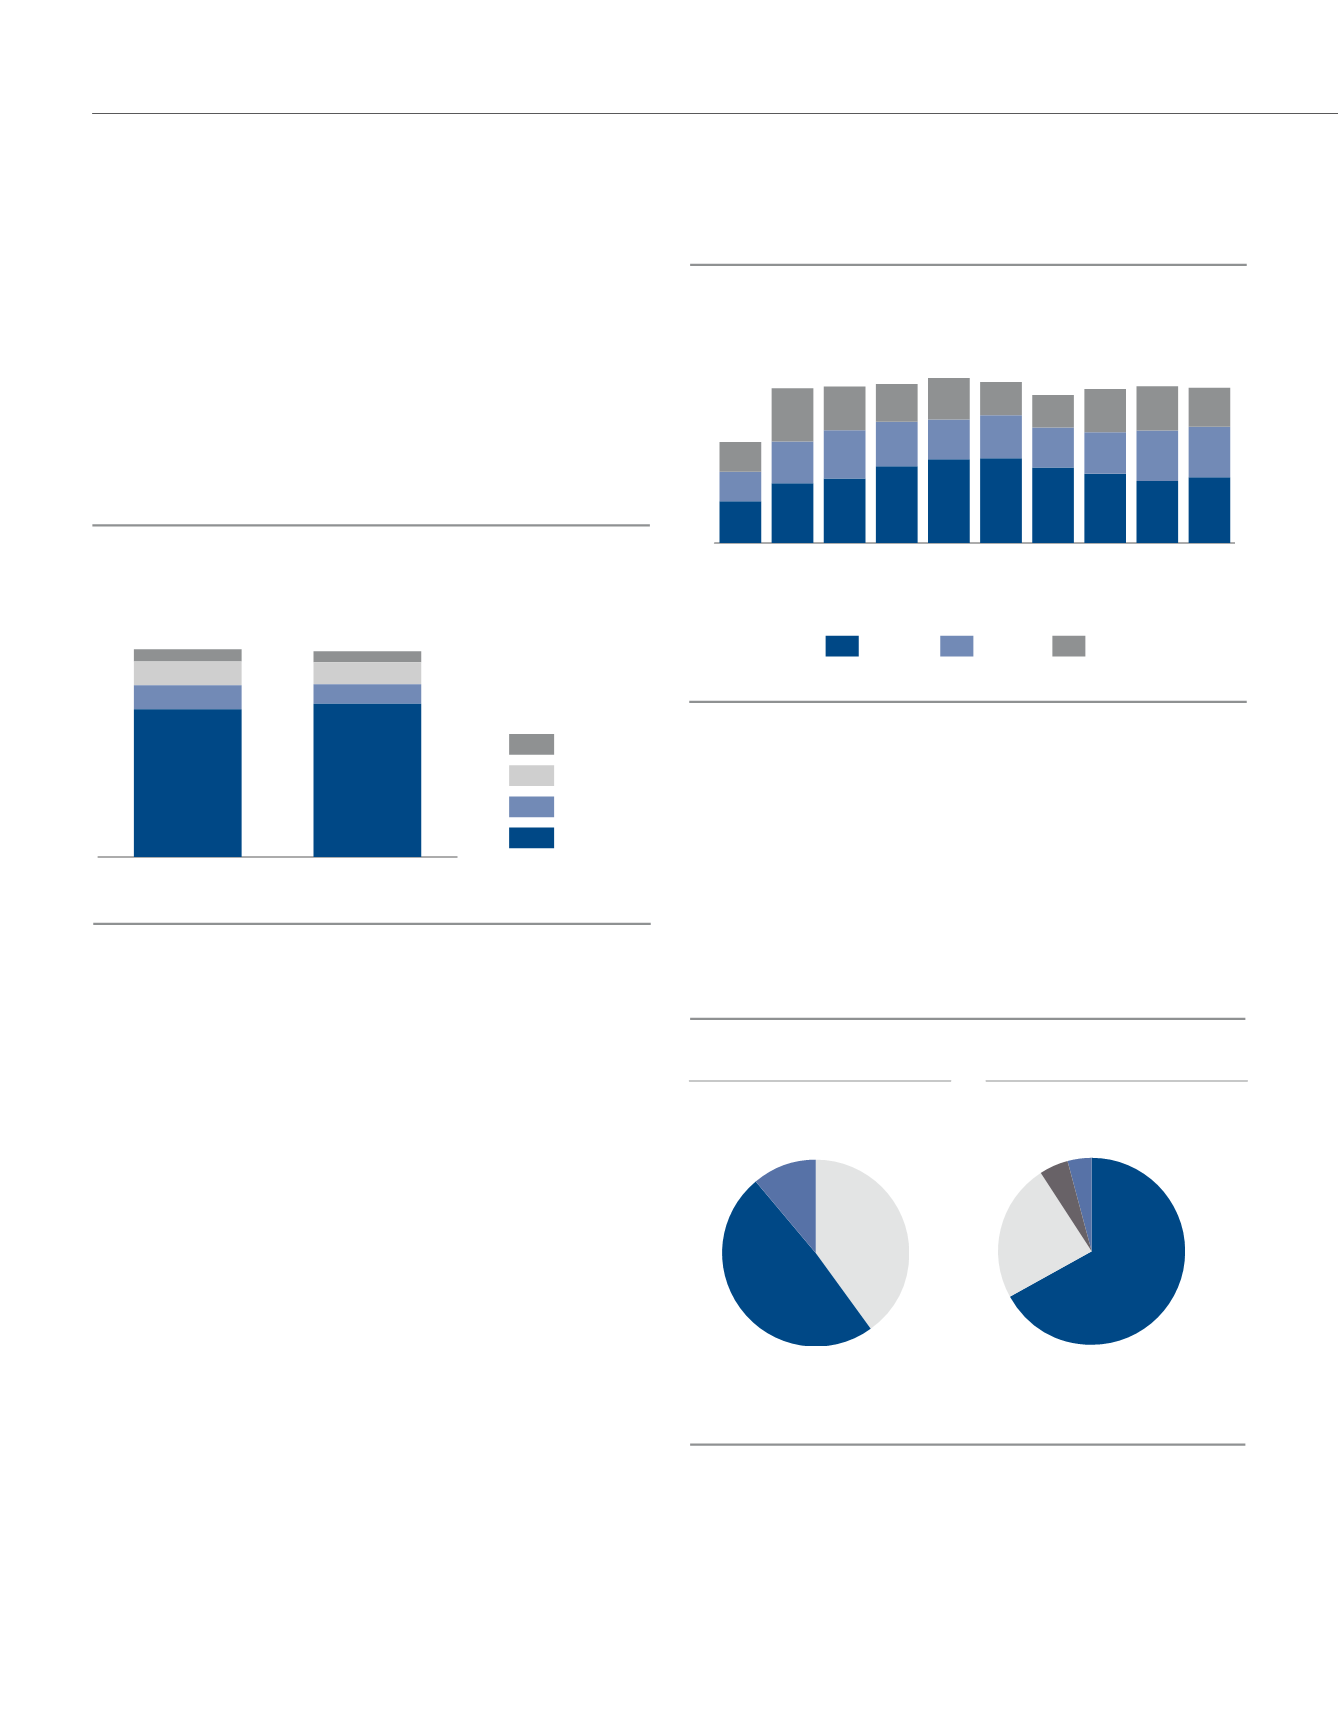
Europe, the Middle East and Africa (EMEA) accounted for 42%
of global DR trading volume, followed by Latin America (33%)
and Asia-Pacific (25%). Since 2007, overall DR trading volume
has grown at a compound annual growth rate (CAGR) of 5%,
demonstrating the continued demand for international equities.
Total DR trading value through June 2016 decreased by
$131 billion (8%) compared to the first half of 2015. Lower DR
trading value from NYSE-listed DRs accounted for the overall
decrease in DR trading value.
DR Trading Value
1
Region
Trading Venue
Total: $1.4 Trillion
Source: Bloomberg and Depositary Data Interchange
Latam
11%
EMEA
49%
APAC
40%
OTC
5%
LSE
4%
NASDAQ
24%
NYSE
67%
DR trading volume totaled 79.4 billion during the first half of
2016 compared to 80.1 billion during the same period in the
prior year, a decrease of 0.7 billion (1%). Trading activity was
mixed across the major trading venues as the London Stock
Exchange (LSE), NASDAQ and Over-the-Counter (OTC) markets
decreased 1.8 billion, 0.7 billion and 0.5 billion in DR trading
volume, respectively. The decrease was partially offset by a 2.3
billion increase in DR trading volume on the New York Stock
Exchange (NYSE).
DR Trading Volume
1, 2
(in DR billions)
OTC
NASDAQ
LSE
NYSE
YTD June 2016
YTD June 2015
4.3
8.4
7.5
59.1
79.4
4.8
9.1
9.3
56.9
80.1
Source: Bloomberg and Depositary Data Interchange
Lower DR trading volume from Russian issuers (1.7 billion)
accounted for much of the decrease in LSE trading volume.
NASDAQ DR trading volume was down primarily due to a 0.7
billion decline in DR trading volume from Australian issuers.
The reduction in DR trading volume on the OTC market was a
result of lower DR trading volume from Brazilian (0.4 billion)
and Japanese (0.1 billion) issuers. The higher NYSE DR
trading volume was largely due to a 2.3 billion DR increase
from UK issuers.
DR trading volume was mixed across sectors. The
communications, energy and technology sectors declined
by 2.7 billion, 1.8 billion and 1.5 billion DRs, respectively.
The decline in DR trading volume from those sectors was
offset by an increase in DR trading volume in the basic
materials (3.2 billion) and financials (2.3 billion) sectors.
DR Liquidity
1
Data as of June 30, 2016.
2
Amounts may not sum to total due to rounding.


